
Finance and Water Charges
WATER CHARGES
Water consumers in Hong Kong pay less for high quality fresh water than their counterparts in most major cities around the world. Water charges have not been revised since February 1995 (other than the charge for non-local vessels which was last revised
in June 1996).
SCALE OF CHARGES
Fresh water for domestic use (other than flushing) is charged at four- month period rates set out in a four-tier system as follows.
| Charging rate per unit of one cubic metre | |
|---|---|
| Tier 1 for the first 12 units | Free |
| Tier 2 for the next 31 units | $4.16(Note 1) |
| Tier 3 for the next 19 units | $6.45(Note 2) |
| Tier 4 for the remainder | $9.05(Note 3) |
Fresh water for other uses is charged at different rates as follows based on the purpose of consumption.
| Purpose | Charging rate per unit of one cubic metre |
|---|---|
| Trade | $4.58(Note 4) |
| Construction | $7.11(Note 5) |
| Shipping (Non-local Vessels) | $10.93(Note 6) |
| Shipping (Local Vessels) | $4.58(Note 7) |
| Any purpose other than Shipping (Non-local Vessels) where payment is made against a prepaid ticket |
$4.58(Note 7) |
| Flushing per 4 month period | |
| - for the first 30 units | Free |
| - for the remainder | $4.58(Note 7) |
Note 1:
When the tariff structure was introduced in 1979, the charge for the second tier was to recover approximately the net unit production cost, which meant the full unit production cost (including a target rate of return on ANFA) less the average contribution from rates per unit, calculated based on the quantity of the metered consumption. In the subsequent tariff reviews, the proposed charging rate for the second tier was not equal to the prevailing net unit production cost because a uniform rate of increase for all tiers was adopted taking the waterworks operating costs as a whole. In 2014-15, the net unit production cost is $11.0, which is materially higher than the charging rate of $4.16, mainly because water tariffs have not been changed since 1995.
Note 2:
When the tariff structure was introduced in 1979, the charge for the third tier was to recover approximately the full unit production cost which meant the average production cost per unit (including a target rate of return on ANFA), calculated based on the quantity of the metered consumption. In the subsequent tariff reviews, the proposed charging rate for the third tier was not equal to the prevailing full unit production cost because a uniform rate of increase for all tiers was adopted taking the waterworks operating costs as a whole. In 2014-15, the full unit production cost is $15.1, which is materially higher than the charging rate of $6.45, mainly because water tariffs have not been changed since 1995.
Note 3:
The fourth tier is set at about 40 per cent higher than the third tier to discourage extravagant and wasteful use of water.
Note 4:
Prior to 1992, the charging rate for trade purpose was equal to the second tier rate for domestic purpose. Commencing from 1992, the charging rate for trade purpose was set higher than the second tier rate for domestic purpose mainly for reducing the subsidy to non-domestic consumers.
Note 5:
Prior to 1992, the charging rate for construction purpose was equal to the third tier rate for domestic purpose. Commencing from 1992, the charging rate for construction purpose was set higher than the third tier rate for domestic purpose mainly for reducing the subsidy to non-domestic consumers.
Note 6:
The charging rate for shipping (non-local vessels) was last revised in 1996, setting at 40% above the full unit production cost at that time for discouraging the taking of water in Hong Kong.
Note 7:
These charging rates were set at the rate equal to the charging rate for trade purpose.
Sea water for flushing is supplied free of charge.
Waterworks operations have seen deficits since 1998-99 which means that it is subsidised by general government revenues. In 2014- 15, the deficit was $1,015.0M and the cost recovery rate was 88.8%. The Government continues to review the water tariff periodically, taking into consideration a number of factors, including affordability, financial performance of waterworks operations, the prevailing economic situation and the views of Legislative Council members.
Other than water charges, there are 25 statutory fee items stipulated in the Waterworks Regulations (Cap. 102A). We have been periodically reviewing these fee items in accordance with the Government-wide "user pays" principle which aims to recover the full cost of providing services. During the year, 25 statutory fee items have been revised effective from 1 January 2015.
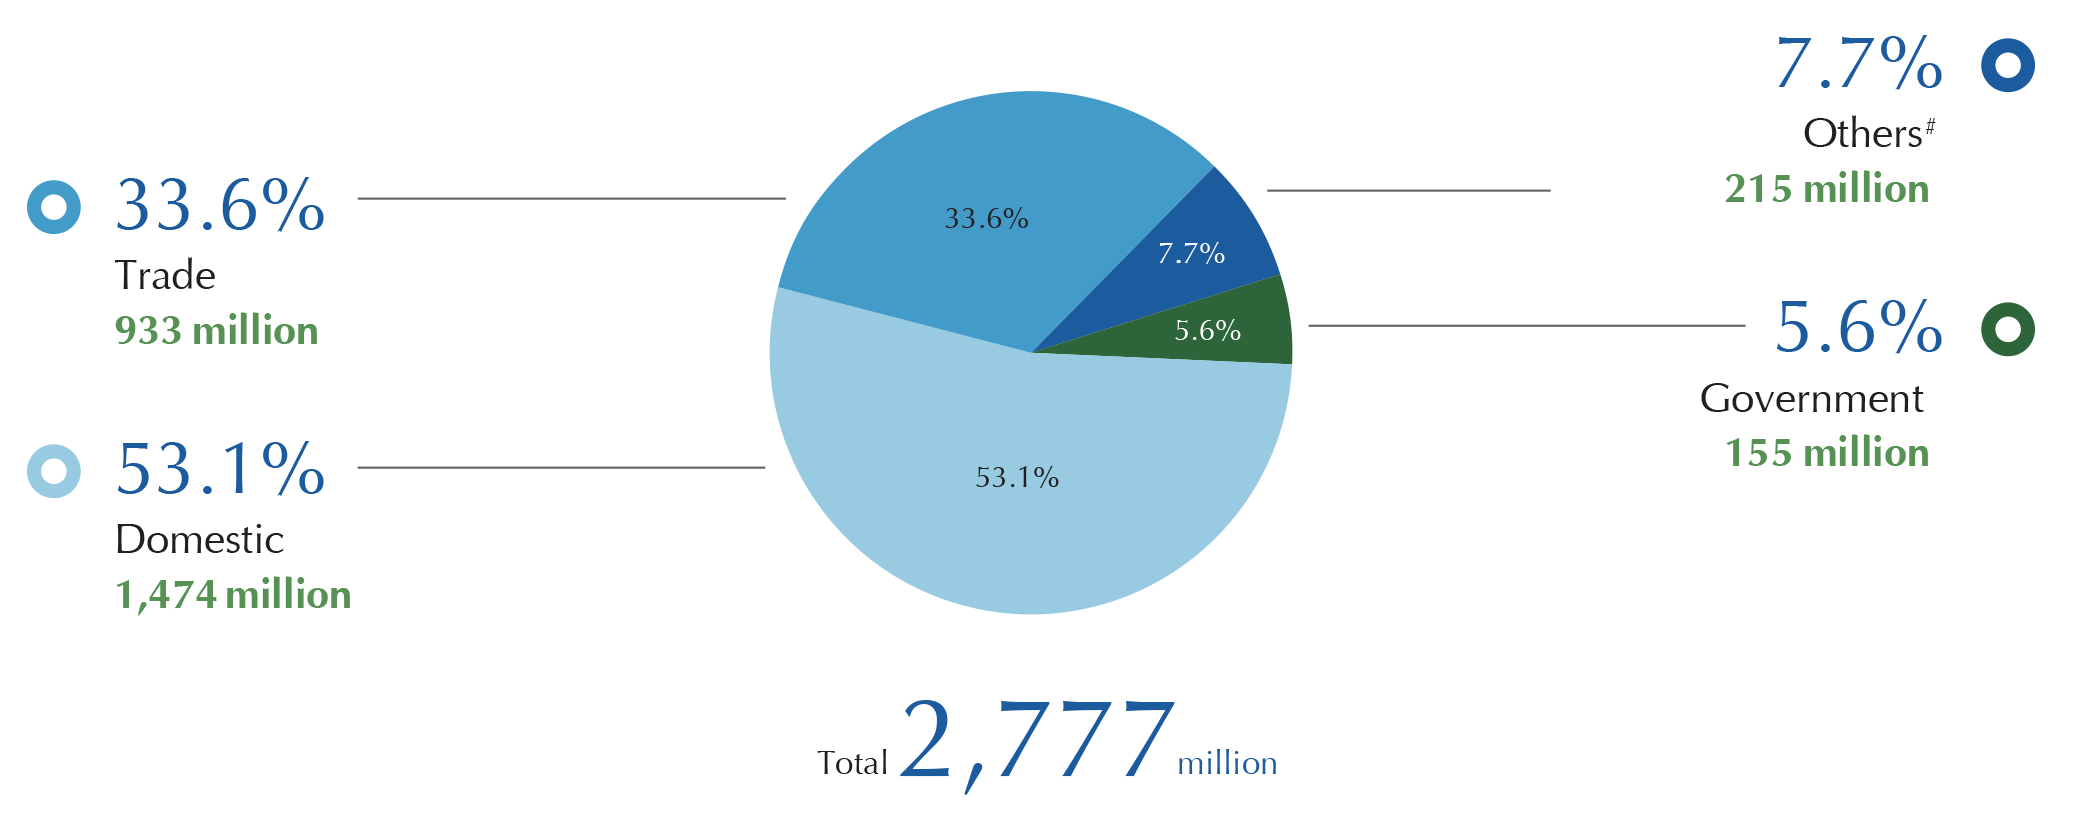
PROFILES OF THE REVENUE FROM WATER CHARGES
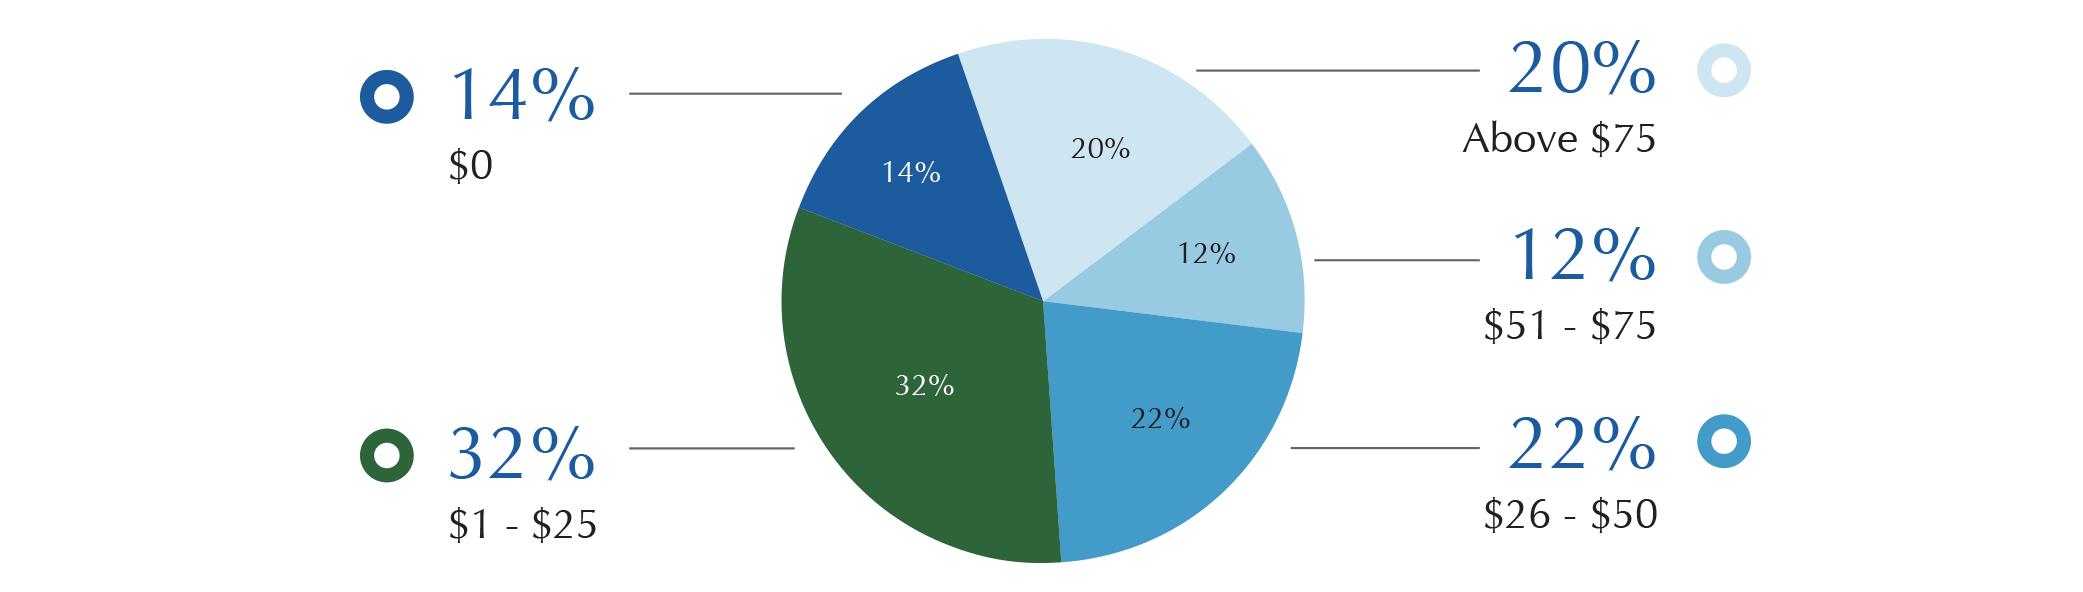
During the year 2014-15, about 14 per cent of domestic customers were not required to pay water charges, 42 per cent were paying up to the tier 2 rate of $4.16 per unit, 20 per cent were paying up to the tier 3 rate of $6.45 per unit and 24 per cent were
paying up to the tier 4 rate of $9.05 per unit. For the 2.6 million domestic customers, the average water charge in 2014-15, including those not required to pay any charge, was $47 per month. According to the Census & Statistics Department household
expenditure survey, the water charge amounts to about 0.3 per cent of the average monthly household expenditure.
An analysis of the water charges by sector over the past five years is as follows.
An analysis of the water charges by sector over the past five years is as follows.
| $M | 10/11 | 11/12 | 12/13 | 13/14 | 14/15 |
|---|---|---|---|---|---|
| Trade | 896 | 913 | 905 | 903 | 933 |
| Domestic | 1,408 | 1,414 | 1,437 | 1,452 | 1,474 |
| Government | 163 | 155 | 156 | 159 | 155 |
| Others# | 160 | 175 | 185 | 201 | 215 |
| Total | 2,627 | 2,657 | 2,683 | 2,715 | 2,777 |
# including fresh water for flushing
Water Charge (% by Sectors) 2014/15
# including fresh water for flushing
ANALYSIS OF REVENUE AND EXPENDITURE
The revenue collections include chargeable water supplies, fees, licences, and reimbursable work. In preparing the Waterworks Operating Accounts which present the financial results and positions on an accrual accounts basis, the revenues include non-cash
items, mainly contribution from rates, contribution from free allowance, and water supplies for government usage. The total operating costs include mainly staff costs, purchase costs of Dongjiang water, depreciation, operating charges, plus administration
and other expenses. An analysis of the revenue and expenditure over the past five years is as follows.
Revenue
($million)
| Financial Year | 10/11 | 11/12 | 12/13 | 13/14 | 14/15 |
|---|---|---|---|---|---|
| Chargeable Supplies | 2,463.9 | 2,502.6 | 2,527.2 | 2,555.8 | 2,622.0 |
| Contribution from Rates | 2,692.3 | 2,947.4 | 3,561.0 | 3,970.6 | 4,263.4 |
| Contribution from Free Allowance | 1,112.8 | 1,173.4 | 912.4 | 918.7 | 962.7 |
| Supplies to Government Establishments | 163.2 | 154.5 | 156.2 | 159.0 | 155.1 |
| Fees, charges and others | 22.3 | 29.0 | 31.0 | 26.5 | 28.9 |
| Total | 6,454.5 | 6,806.9 | 7,187.8 | 7,630.6 | 8,032.1 |
Distribution of Household Average Monthly Bill 2014/15
Expenditure
($million)
| Financial Year | 10/11 | 11/12 | 12/13 | 13/14 | 14/15 |
|---|---|---|---|---|---|
| Staff costs | 1,300.4 | 1,401.3 | 1,486.0 | 1,528.7 | 1,586.6 |
| Operating, Administration & Other Expenses | 1,635.6 | 1,680.3 | 1,698.3 | 1,747.9 | 1,841.0 |
| Dongjiang water | 3,200.0 | 3,397.1 | 3,594.5 | 3,802.2 | 4,031.2 |
| Depreciation | 1,273.8 | 1,353.5 | 1,416.7 | 1,482.7 | 1,588.3 |
| Total | 7,409.8 | 7,832.2 | 8,195.5 | 8,561.5 | 9,047.1 |
The Department is committed to providing services as cost effectively as possible. We have made substantial investments in fixed assets, equipment, information technology and human resources to improve operational efficiency and staff productivity to
meet the demands for a higher quality of services by the public. Our customers and the public at large can rest assured that we will exercise strict financial discipline and be very cost conscientious in delivering our quality services to meet
the demand of our customers. This is our underlying approach in achieving our vision and missions.

